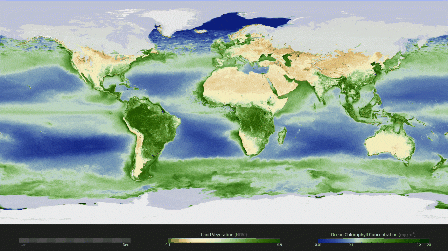
Stunning! View Nasa’s animated map that breathes like the earth

The video below reveals the 12-month life cycle of the world’s plant life. Pulsating masses of color represent fluctuations of density of plant growth on land and chlorophyll concentration from phytoplankton in the oceans. Density of land vegetation on the map ranges from barren brown to rich green where plant life is the most luscious. The same applies to ocean concentrations. The map varies according to changing seasons and the ability of sunlight!
Winter in higher latitudes shows the southern hemisphere experiencing summer and more plant growth, while the reverse is true for summer in the north. Plant density moves up and downt he latitudes giving a breathing effect.
- Log in to post comments
